
Ramaphosa’s Manifesto – “A New Deal” – envisages the “massifying” of black enterprises to promote growth and job creation. It is shaped – like the National Development Plan – by the paradigm of SMEs as prime agents for growth and jobs. As the belief in the curative effects of bloodletting – it was the general consensus – acted as a barrier that prevented the consideration of alternative treatments, the belief in SMEs obscures evidence that net job creation is largely independent of firm size.
Convictions, one must remember, do not necessarily yield to evidence.

For the creation of several hundred thousand successful businesses (or would “massifying” – Ramaphosa’s term – imply businesses by the million?) there needs to be at least a similar number of entrepreneurs with effective business skills and plans for these businesses to have a chance of survival.
But for a business to succeed one needs other ingredients than mere entrepreneurial aptitude and astute management: it requires support from customers and clients. Successful “massifying” of new businesses would therefore depend on a prior (or at least simultaneous) mushrooming of the spending power of existing consumers and/or the “massifying” of consumers.
On that, the New Deal is silent… Could a 2016 warning about economic transformation hold the explanation?
The way enterprises find spatial footholds (how they occupy entrepreneurial space) resembles ecology. Arid environments have a lower specie density and richness than tropical environments. The difference in the enterprise offering in Nkandla and Sandton illustrates the case concerning enterprise densities and enterprise type richness.
Whether one has to do with enterprise “rainforests” or “deserts,” is determined by the combination of:
- The population size of the locality;
- Average household income levels; and
- The presence of productive knowledge and special entrepreneurship.
Eric Beinhocker (The Origin of Wealth) says the economy is a truly evolutionary system. It indeed has similarities with nature. In large free-roaming reserves there are correlations between vegetation and both the density and range of herbivores that rely on vegetation. The Namib desert with less forage than the Serengeti Plains, has a lower specie density and richness. In the Serengeti, the abundance of forage (good rains boost the carrying capacity of the veld) or the scarcity thereof (due to droughts or the dry seasons) cannot support the same size of herds right through the year. The result: the twice a year spectacular wildebeest trek between the Serengeti and the Masai Mara Reserve that requires the Mara crossing where both rapids and crocodiles take their toll.
In similar manner, the enterprise carrying capacity of localities is determined by the funds available in a locality (consumer and investment expenditures) as well as the capacity to lure additional funds from outside the locality (exports).
The result of this is far more spectacular than the wildebeest treks between Tanzania and Kenya. On a global scale, millions of enterprises pursue their objectives by providing an endless stream of products and services. Billions of customers (whether individuals, other businesses or legal persons) select goods and services they require or aspire to acquire. This most participatory process on earth driven by countless decisions determine not only the surge, decline and demise of products and services, but also the survival or demise of enterprises.
The latter is of great significance. EOSA’s analyses of a dataset of almost 100 000 formal businesses in more than 450 SA cities and towns reveal:
- spontaneous patterns of enterprise sectors with such high regularity that forecasting applications can be developed, and
- in the majority of enterprise sectors there is not a shortage of enterprises.
This raises a fundamental question: which entrepreneurial space will the envisaged mass of new businesses occupy?
EOSA records the spontaneous patterns through a range of correlations. [NB: there is no need to be a practised interpreter of figures to follow the few examples here. Look at two things: (a) How densely are the dots grouped around the regression line, & (b) how close to 1 is the correlation figure (“r” in the box). The closer grouping of dots and the closer r is to 1, the more meaningful the relationship]
The first figure looks at the population (horizontal axis) and the number of enterprises (vertical axis) in 370 SA cities and towns. The grouping of the dots is not very dense with several localities at a distance from the line with Mbombela the furthest from the line. In this case, 84.5% of the variance can be explained and a correlation of r = 0.921 over 370 data points is extremely significant.
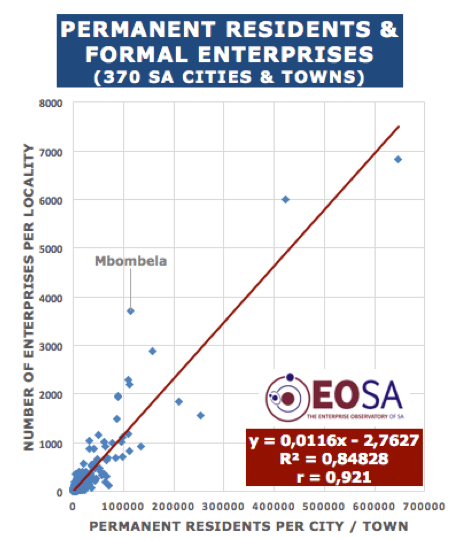
The dots that are some way above the regression line carry “more businesses” than what one would expect given the population size. The dots that are significantly below the regression line indicate towns with “fewer businesses” than what their population would suggest. The question is whether the massifying of businesses could be pursued in the dots (towns) below the line to get them all a Mbombela position?
There are clear reasons why these towns are at some distance from the regression line. Those above form two categories benefitting from regular consumers from outside:
- Centres near large traditional rural settlement populations (Mbombela and Richards Bay), and
- Towns that regularly draw consumers from outside like tourists (e.g. George, Clarens, Dullstroom and Greyton.)
Towns below the regression line with “fewer businesses” also fall into two groups: towns with a high concentration of employees in a few dominating large employer firms (Sasolburg and Welkom) or towns exporting a significant portion of their population through daily or weekly migratory labour (Thaba Nchu and Siyabuswa).
Entrepreneurial space (and therefore opportunities) are not just lying vacant waiting for the massification of enterprises.
A pattern with highly significant correlations can be observed between the number of enterprises in (most) sectors in a locality and the total number of enterprises in the locality. These correlations reveal the extent to which entrepreneurial space is occupied by enterprises belonging to enterprise sectors. The correlation between the total number of enterprises in a town or locality and the total number of traders in that locality, is close to the perfect statistical 1 (r = 0,9959) and the dots are mainly on the line.
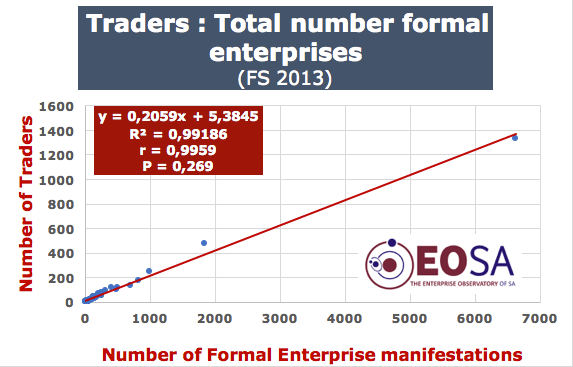
The space for traders (supermarkets – whether a national chain or a local independent store, corner café’s, clothing or stationery stores) is therefore automatically filled by entrepreneurs. Massifying traders in a stagnant town would lead either to failure of the new ventures or their survival at cost of existing traders.
Churn of enterprises does not expand the number of businesses or per definition enhance job creation: it could imply job losses if the new firm has fewer employees than the firm replaced.
The high constancy of the correlations suggests that in the majority of sectors there is limited entrepreneurial space available unless the flow of funds into such a community would increase. Only in a limited number of sectors (factories, processors, tourism & hospitality, mining and agricultural products & services) entrepreneurial space cannot be simply deduced from the total number of enterprises in a locality. The reason is obvious: enterprises in these sectors are far less dependent on local consumer spending. To attract clientele, entrepreneurs in these sectors have to market their services and goods outside the locality.
Such regularities are universal.
A third important correlation observed is between the total number of firms in an enterprise sector (e.g. financial services sector) and the number of firms belonging to a specific enterprise type within that sector (e.g. auditors & accounting firms). The figures below reflect extremely strong correlations between:
- the number of traders in localities and the number of grocers in those localities, and
- the number of construction sector enterprises in localities and the number of building materials suppliers in those towns.

These are a few of several significant regularities that “determine” entrepreneurial space. These regularities have not been devised in one or other National Development Plan: they are the outcome of billions of un-coordinated decisions of both entrepreneurs and consumers. It is a self-regulatory spontaneous order that determines entrepreneurial space in (the majority of) enterprise sectors.
These regularities enable EOSA to assess the potential increase or decrease in enterprise types should a town grow or decline.
SA’s policy makers and administrators have a blind spot for these regularities. Ignoring these regularities (as Government does with its promotion of cooperatives) guarantees failure. Failing to grasp these dynamics also scuttled umpteenth LED initiatives.
The paradigm driving the current approach to economic development and enterprise policies, is built on assumptions:
- An effective developmental state with government driving economic development through state-owned enterprises (an assumption as far removed from reality as east is from west);
- Governmental superiority to the spontaneous order as judge of which enterprise sectors as well as individual businesses would be winners, therefore massifying (black) entrepreneurs to be funded through grant schemes (BIS, National Gazelle program and Cooperative Incentive scheme) to become economic cadres for transformation;
- The need to constrain existing enterprises (considered as beneficiaries of colonisation and apartheid) to ensure racial transformation.
The self-assured conviction of being right incapacitates the definers and implementers of these policies to see the bedrock of strong regularities in the world of enterprise.
There is however a difference between a conviction and an obsession. On 23 March 2016 Ramaphosa acknowledged his obsession with BBBEE and ranted against white monopoly capital: “We are going to intensify BBBEE. We are going to sharpen our teeth… The time of white business monopolies is over… Government is hell-bent on making sure blacks owned and managed the economy. For far too long this economy has been owned and controlled by white people. That must come to end. Those who don’t like this idea – tough for you. That is how we are proceeding… We have become fanatical about it.“
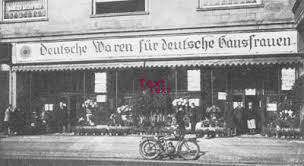
Without massifying consumer spending (only possible through asset redistribution or non-stop money printing) the only alternative way to support the envisaged tsunami of new businesses is probably an unvoiced intention to replace existing businesses. This was done before in Nazi Germany and also with farm grab in Zimbabwe.
It is time to challenge the paradigm that promotion (massifying) of SMEs by the state is the best route to achieve economic growth and job creation. Economic growth (and job opportunities) will be better served by:
- accepting and operating with the regularities inherent in the enterprise world and
- nurturing enterprise-friendly environments.
(Next blog: How Government can improve the enterprise environment).

2 thoughts on “Are our enterprise policies shaped by obsessions? Paradigm paralysis (2)”