
Johannes Wessels (@johannesEOSA1)
A tumult about a shampoo advertisement diverted attention from the biggest economic decline under the ANC government to date. A quarterly GDP figure that confirmed the country is plunging into poverty got less attention than a Clicks advertisement. The deteriorating economy will entrench the country in the bottom half of the Economic Complexity Index (ECI), making it less and less attractive as a destiny for both skills and capital.

Splitting “frizzy and dull” hairs from “fine and flat”, however, is apparently for South Africans far more important than worrying about an additional three million unemployed or thousands of businesses pushed into the abyss of loss and debt. Reading Figure 1 (ECI data) reminds of the typical good-news, bad-news joke: the bad news is that SA has slipped from the top third of countries to the middle third. The good news is that this ranking is far better than where the country is heading for. The ECI, developed by Ricardo Hausmann of Harvard and Cesar Hidalgo of MIT, measures the productive capabilities of large economic systems, whether cities, regions, or countries and is based on the knowledge accumulated in a population that gives expression to the diversity and complexity of economic activities.
Almost simultaneously with the DA’s embrace of non-racialism as a pillar of their redress strategy that will not use race as a yardstick to address inequality, the 2020 Q2 GDP demolition figure was released. The throttling of the economy by the government’s lockdown strategy made far less ripples than what TREsemmé claims to smoothen out in frizzy hair.
The commentariat treated the DA like TREsemme
It was not only the Twitterati that underplayed the economic news: the same sentiments dominated in serious opinion pieces and radio and TV talk shows. And the commentariat effectively placed the DA in the same box as TREsemmé:
- Carol Paton, editor at large of Business Live, reckons race will matter forever and lamented the DA’s policy removal of race-based redress “since that will affirm suspicions that the DA is a party whose real agenda is to defend white privilege by denying that such privilege exists at all”.
- Stephen Grootes, radio presenter and Maverick columnist, echoed that “firm evidence and the lived experience of South Africans” indicate whites are rich and blacks are poor.

A Coalition of the Offended encompassing inter alia Julius Malema, the Daily Maverick, Justice Malala and Twitters’ @BiancavanWyk16 emerged: all deeply shocked and emotionally wounded, found Clicks’ sacking of an executive and suspension of selling TREsemmé insufficient.
Some called for “attacks” on Clicks stores and the malls that provide rental space for Clicks. Others demanded a sort of #BlackHairMatters kneeling, some were just happy to find something to be unhappy about and some considered the actions of others in the coalition either overboard or underwhelming.
Whilst one can understand that the EFF, the ANC and a plethora of beneficiaries or wannabe-beneficiaries of BEE, are obsessed with affirmative action, expropriation without compensation and preferential procurement mechanisms enabling hiked prices, it remains amazing that leading commentators such as Paton and Grootes ignore the hard evidence that race is not the best proxy for measuring inequality and that the application of race fails to target those really at the bottom of the pit.
Way back, Census 2011 already provided evidence that education is a far more reliable marker.
Race as a marker for household income inequality weighed and found wanting
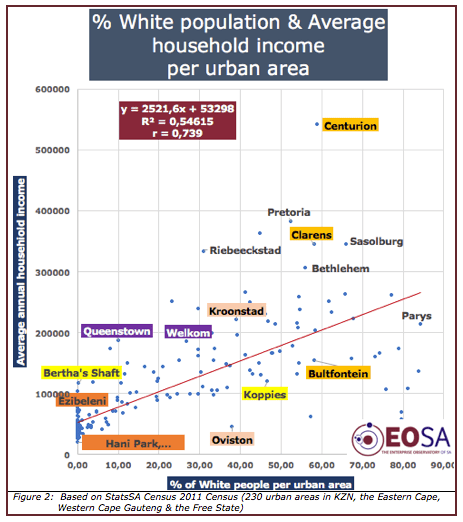
EOSA analysed demographic and household income data for 230 urban areas in Gauteng, the Free State, Western Cape and Eastern Cape (2011 StatsSA data). The data shows the former white urban by 2011 had black populations ranging from 16% to 54%, whilst in the townships, the white population percentage ranged from 0 to 1.5%. If race is the proxy for inequality, there should be a significant correlation with high average household incomes conforming with urban areas with a larger white population.
Plotting the percentage of the white population of these 230 urban areas (horizontal axis, Figure 2) and the average annual household income for each of these urban areas (vertical axis), revealed a significant correlation of r = 0.739. However, the data points are not densely concentrated to the trendline. The distribution of the 230 data points resembles a hail gunshot.
Before he departed from the DA, Musi Maimane had insisted that race was the “only consistent measure” for inequality. Does Figure 2 and its correlation prove Maimane as correct? And does this confirm Grootes’ “firm evidence and lived experience” that whites are rich and blacks are poor, or Paton’s belief that a non-racial approach is “a step away from any responsibility for racial reconciliation”?
Musi, Carol & Stephen: please explain the following using race as the reason
If so, Maimane, Paton and Grootes should have no difficulty explaining in racial terms:
- How racial inequality contributes to household inequality between Hani Park, Thabong (ave. household income of R19 455) and Ezibeleni, Queenstown (ave. household income R78 792)? Both these urban areas had no white residents in 2011. (Dark orange-tinted blocks).
- How racial inequality caused the variance in average per annum household income between Centurion (R541 570), Clarens (R344 215) and Bultfontein (R153 849) with white populations almost an identical share of their total populations (58%)? See light-tinted orange blocks.
- Why could Queenstown register an average household income of R187 431 compared to Welkom’s R185 318 whilst having a substantially smaller white population share (10.2%) than Welkom’s 26.9% (Purple blocks).
- Which racial inequalities caused the differences in average household income between Kroonstad’s R221 023 and Oviston’s R45 008, considering that their white populations were respectively 39.1% and 38% (Pink blocks).
- In which mysterious ways racial inequality works in the case of Bertha’s Shaft with 0.2% white population having an average household income on par with Koppies that had 47% white population? (Yellow blocks).
Other factors than race contribute to these sometime stark differences. In fact: race (indicated by the percentage of the white population in an urban area) explains 54.6% of the variance in average household income: significant, but insufficient unless Musi, Carol and Stephen can render these explanations
That was the case in 2011 already and it would be more evident now.
Tertiary qualifications a more precise indicator of household inequality
EOSA shares Haussmann’s insight that productive knowledge is essential for economic complexity and the more complex and diverse a country’s economy is, the more robust and competitive that country is concerning growth, wealth creation and unemployment destruction.
Since data on these indicators at local (town or city) level is almost non-existent in the SA context, EOSA tested some proxies. One factor that contributes (but is not equal) to productive knowledge, is the percentage of the population (20 years plus) with tertiary qualifications. A proxy for economic complexity is enterprise richness: expressed by the number of different enterprise types.
Testing the correlation for the same set of 230 urban areas between the percentage of the population 20 years plus with a tertiary qualification and average household income renders an interesting picture (Figure 3).

An extremely significant correlation of r=0.93 emerged. It confirms that inequality in average household income in urban areas is better explained by looking at tertiary qualifications rather than race. Note also the dot distribution pattern around the regression line which shows a much closer fit.
Tertiary qualifications explain 86.4% of the variance in average household income, compared to 54.6% when using a racial marker. And it is more useful pointing out possible avenues to address inequality.
Take the three highlighted urban areas (Figure 3) as an example. The average household income in Clarens and Sasolburg was virtually on par, but Clarens (55.5%) had a significantly higher percentage of the population with tertiary qualifications than Sasolburg (34.1%). The difference lies in the nature of the qualifications and the productive knowledge base. Sasolburg has more engineering and natural sciences degrees and therefore yield higher salaries and a higher household income than the Clarens-based degrees and diplomas in the arts and humanities. The Sasolburg based pool of productive knowledge enables the existence and operation of complex industries with a range of interrelated service industries. Clarens has a high percentage of graduated retirees who pursue lifestyle businesses (e.g. restaurants, gift and coffee shops, guest houses) with sufficient time to play golf and to go horse riding in the countryside.
It also explains why Sasolburg, with a similar percentage of tertiary qualified population as Fouriesburg, has double the average household income of Fouriesburg.
Seeking race in everything is like apartheid’s pencil test
Correlation does not prove causality for race or tertiary qualifications. Nevertheless, the statistically clear differences in the variance prove that the percentage of the population with a tertiary qualification is a much sharper tool to measure income inequality and it simultaneously renders insights for strategies. One can do something about poor education and localities and regions can nurture and attract productive skills.
Continuing with the racial yardstick whilst functional non-racial indicators, e.g. education, location and enterprise richness are available, is akin to apartheid’s infamous pencil test: if a pencil pushed into hair didn’t fall out when the person bent forward, it was an argument to classify that person as non-white.
The fact that the ANC hasn’t been able to deliver quality education is one of the most critical factors entrenching inequality. Commentators seem also to back away from a non-racial perspective. Committing to a non-racial perspective is a choice, but some prefer to continue with the pencil test. Pushing pencils through frizzy and flat hair doesn’t change income inequality.
Don’t export your productive knowledge
Productive knowledge is what underpins economic complexity and ensures that countries like Singapore and South Korea (Figure 1) play in the top league with Switzerland, Japan, the US and Sweden.
Keep in mind that data used in Figures 2 & 3 dates back to the 2011 Census. There is, however, no reason to expect that the current situation would render weaker outcomes.
Now, back to the last years of Thabo Mbeki’s presidency with Trevor Manuel as minister of finance. Under internal pressure from the populists and socialists within the ANC, as well as the alliance partners SACP and Cosatu, Mbeki tried to placate the criticism of the Growth, Employment and Redistribution (GEAR) policy, by embarking on AGISA (Accelerated Growth Initiative for SA) that was quickly adjusted by adding an S to become the Accelerated Shared Growth Initiative (AsgiSA).
Mbeki established an international panel of advisers, led by Hausmann. In 2007, they recommended adjustments to affirmative action and BEE to make these instruments growth compatible, and they urged the government to “do everything to stop and reverse the emigration of high-skilled whites”.
The Hausmann panel advised the following: “Encouraging the retention of all high skilled South Africans and the attraction of foreign high skilled persons will be crucial to limit wage inequality and facilitate the creation of jobs for the less skilled and thus achieve shared growth.”
The proposals were ignored. The pursuit of the National Democratic Revolutionary (NDR) agenda and the transformation of society was of higher value than economic growth, job creation and service delivery. The ANC alliance solidarity trumped good advice and everyone jubilated “viva NDR” even though this encourages wage inequality through a higher percentage of unemployed.
Hausman warned that the exodus of productive knowledge was a major issue that could undermine SA’s competitiveness.
Black professionals joined the skills exodus
The investment by the ANC government in cadres at the expense of skills transformed the national departments, the provincial administrations, the municipalities and the SOEs into facades that existed for the benefit of the incumbents, their families and their comrades. The government’s own White Paper on Migration (2017) acknowledges:
- For every one professional immigrating to South Africa, eight professionals were emigrating.
- White professionals emigrate due to push factors that include fear of change and opportunities open to professionals.
- In recent years, the annual number of black professionals leaving South Africa exceeds the tally of professional white emigrants.
- Whilst the NDP prioritises skills acquisition to promote inclusive growth, the government has not devised or implemented adequate policy & strategies for retaining and/or recruiting such skills.
- Between 1989 and 2003 120 000 of the 520 000 mainly white emigrants had professional qualifications (one in four) and SA lost 7% of its total stock of professionals.
Whilst exports are normally required to propel economic growth, the export of productive skills attain the exact opposite. As long as the government ignores the Hausmann recommendations on BEE, that long they effectively provide an incentive for the export of productive knowledge.
Our destiny: Venezuela and Zimbabwe?
Since 2003 the depletion of productive knowledge continued. The sad trajectory of SA (figure 1) on the Economic Complexity index, dropping from position 47 to 63 is proof thereof. Skills matter, and as Hausmann’s report had stated: “The shortage of highly skilled workers causes a lower demand for low skilled workers and the lack of engineers may cause the loss of hundreds of blue collar jobs.”
SA is now well-positioned to emulate those two darling countries whose regimes are so close to the heartbeat of the ANC: Zimbabwe and Venezuela that have dropped to the bottom 10% of the countries.
Anyone who had harboured hope (or still does) that Ramaphosa will pursue business-friendly policies to unshackle enterprises from the anti-growth leg-irons of BEE and also free the population from the opportunity cost burdens of preferential procurement and costly inefficient State-owned enterprises, took no note of Ramaphosa’s commitment to BEE. They also did not take notice of his veiled but clear threats to the private sector to toe the line and live with what the government wants.
Hausmann’s advice rejected by Ramaphosa
Three examples suffice:
- In March 2016 Ramaphosa said the time of white business monopolies was over (at that stage he supported Pres Zuma in referring to white monopoly capital). He said Government was hell-bent on making sure blacks owned and managed the economy (We will end white control of the economy.) “For far too long this economy has been owned and controlled by white people. That must come to end. For far too long, this economy has been managed by white people. That must come to an end. Those who don’t like this idea – tough for you. That is how we are proceeding.”
- In his New Deal for South Africa (14 Nov 2017) Ramaphosa said “We need to massify the creation, funding and development of black-owned small businesses, township businesses and co-operatives.” It is Kindergarten economics that for a business to survive and to profit it needs clientele. The New Deal is silent on who would buy the goods and services from that mass of new businesses in an economy that doesn’t grow faster than its population growth. There are only two options in such stagnant conditions: more state procurement that would increase the budget deficit and if that is not possible, suffocating existing businesses and redirecting clientele away from them towards the “mass” of the new black-owned enterprises. The latter is the strategy Hitler pursued to minimise the participation of the Jews in the economy.
- On 18 June 2020 in a virtual Parliamentary session, Ramaphosa said “the BEE policy thrust needs to be enhanced. The Constitution says that in order for us to obtain equality we have got to have legislative measures that will enable us to do precisely that. So, BEE is here to stay.”

The president just doesn’t get Hausmann’s message: It is easier to move brains with knowledge than to move knowledge into brains. Compacts by “social partners” will not restore growth and jobs. The longer the ANC continues with making race more important than economic growth, the more productive knowledge and skills will skip the country.
Skilled South Africans are already contributing significantly to making Mauritius a high-income country whilst South Africa is constantly slipping downwards to the ranks of the low middle-income countries (Figure 4). For more information on SA’s brain drain, click here.
